A case of knitted fabric quality control using pareto chart, fish bone diagram and six sigma
- Md. Shak Sadi (1), Md. Sajedur Rahman (2),
Abstract:
Increasing the production rate along with quality improvement is a major challenge in the RMG sector of Bangladesh. For sustaining in competitive textile business it is important to minimize the cost of production and cutting wastage reduction. Fabric quality improvement can prevent the cutting wastage. This paper contains a case of practical implementation of six sigma and its basic tools for weft knitted grey fabric production. The case comes out with a better result for quality improvement. International 4 point fabric checking system has been adopted for the measurement of grey fabric quality level. Effective steps have been taken to find out not only the fabric faults or problems but also root causes for those faults. Application of pareto chart, fish bone diagram and six sigma tools helps solving those problems on priority basis. Corresponding training has been given to quality control team as to prevent those problems in future. The result came out with significant average grading of 4-6 points for knitted grey fabric, which used to be 8-9 in previous production quality.
Key Words: Quality improvement, Six Sigma, Grey fabric, 4 point system
1 Introduction
The challenges and opportunities are increasing and the appropriate response has to be evoked in terms of technological advancement and on-time delivery. Such "quality and quantity" supply has to be done on the basis of right-first-time, right-every-time, quick response approach (Teli, 1996). Quality is one of the most significant performance measures that can considerably influence a manufacturer's competitiveness. High-quality products are influenced by two important factors. One is related to the quality of the product design. The other factor is the degree of conformance of the manufactured products to the design specifications ( Maleyeff et al., 2002).
Improvements in the quality of processes lead to cost reductions as well as service enhancements (Kumar et al., 2010). In the more recent history of the quality development, the quality improvement program Six Sigma has been successful (Thakore et al., 2014).Six Sigma is a systematic methodology for continuous process quality improvement and for achieving operational excellence. Six Sigma methodologies is designed to provide for the application of statistical tools in the context of a process improvement structure summarized by the acronym DMAIC- Define, Measure, Analyze, Improve, and Control. The DMAIC model provides a framework to identify and eliminate sources of variation in a process, improve and sustain performance with well-executed control plans, and promote one process improvement language for all members of an organization to employ (T. Hayajneh et al., ). This study deals with the application of six sigma methodology based on "DMAIC" (Define-Measure-Analyze-Improve-Control) tools to reduce the production defects and improve the quality of grey knitted fabric.
2. Research Methodology
The case study conducted on a knitting factory named "Flaxen Knitting Limited" located at k-105, Shasohgaon, Fatullah , Narayangonj. During the production of knit fabric many faults are found in the fabric. These faults make the fabric poor in quality which may leads to the rejection of the garments from the buyer due to poor fabric quality. Faults in the fabric may also occur in different steps i.e. knitting, dyeing, washing, finishing, cutting, sewing etc. It was observed that the quality of grey fabric greatly affects the quality of garments. So, the detection of defects in the grey fabric state is pre-eminent since it gives the scope of rectifying the faults at the very early state of manufacturing. That's why it has been decided to work on knitting to minimize the defect percentage by using DMAIC approach of Six Sigma methodology. Grey fabrics were evaluated to detect the presence of faults in the fabric rolls. A quality checking team of 2 persons were trained up on 4-point system to measure the amount of faults in the fabric rolls. Incentive to the quality checking team has been given on the basis of their measuring performance for ensuring proper measurement of faults. A production team of two persons were also trained up for reporting about the quality of the fabric rolls received from QC team. Incentive also was given to the production team for proper reporting. Major faults were identified & root causes of these faults were analyzed for taking preventive action against these faults. After improving the quality of the fabric steps have been taken for sustaining this improvement.
3. Implementation
The Six Sigma is not merely a quality improvement strategy in theory, as it features a well-defined methodical approach of application in DMAIC and DMADV which can be used to improve the quality of production (U. Sambhe et al.,). The DMAIC methodology is fundamental to Six Sigma process improvement projects. The DMAIC methodology has five phases Define, Measure, Analysis, Improvement and Control.
3.1 Define
Define is the first phase of the DMAIC methodology of Six Sigma. The main purpose of this phase is to define the requirements & expectation of the customers, boundaries & goal of the project and the process that needs to be improved to get higher quality product. For this research SIPOC was used though different tools are available for define phase.
3.1.1 Problem statement:
The selected industry is suffering from high rate of rejections of their products due to the poor quality, which was resulting them in lower profit margin and bad impression on company reputation.
3.1.2 Goal statement:
To reduce the defect % to minimum level and thereby improve quality of grey fabric, reduce wastages in cutting and increase productivity & company profit as well.
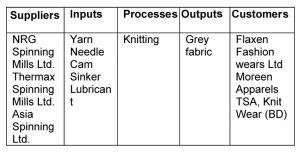
3.1.3 SIPOC
The customer complaint analysis process is defined by using process mapping (SIPOC). This high-level process map helps to define the project boundary, can identify the data collection system and identifies the resources required to carry out the improvement activity (Sanjit Ray, 2011). Table 1 shows the SIPOC flow of the selected factory.
3.2 Measure
In this Phase the performance of the process was measured by collecting the data and which was done by the help of team member. The data collection period was 1st January 2016 to 29th February 2016. International 4 point system (Table 2) was used for grey knitted fabric checking by QC (Quality Checking) team.
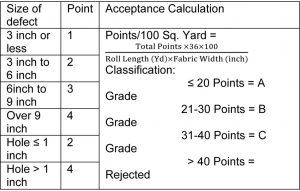
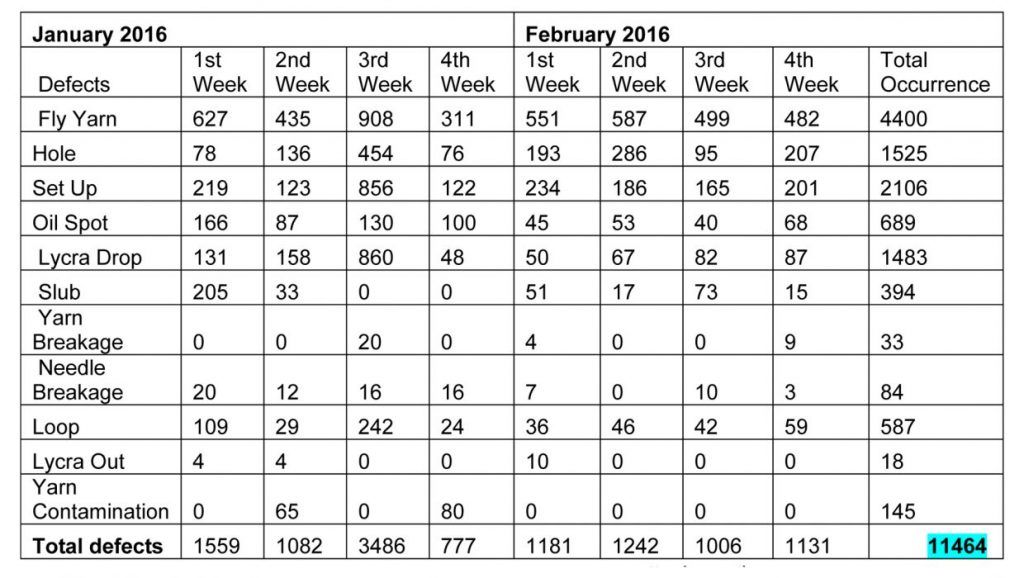
Different types of grey fabrics were evaluated for defect identification. The amount of fabric rolls inspected was varied with the fabric type in every week due to buyer requirement. The production of S/J (single jersey), S/J slub, full feeder lycra S/J, 1×1 rib, 2×1 rib, terry, fleece, single & double lacoste and double pique was higher during the data collection period. All together 4242 rolls have been checked with in the time period.
The number different faults found varied with the variation in the number of inspected fabric rolls. The types of faults found were also varied with the fabric types. The following table shows the amount of fabric faults found in the data collection period.
3.3 Analyze
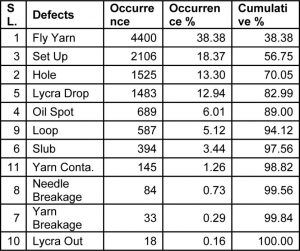
In this phase data collected in the previous phase have been analyzed in order to identify the root cause(s) or source(s) of defects. Frequency of defects were also measured & recorded (Table 4). The tools used in this phase were Pareto chart and Cause & effect diagram.
3.3.1 Pareto Chart
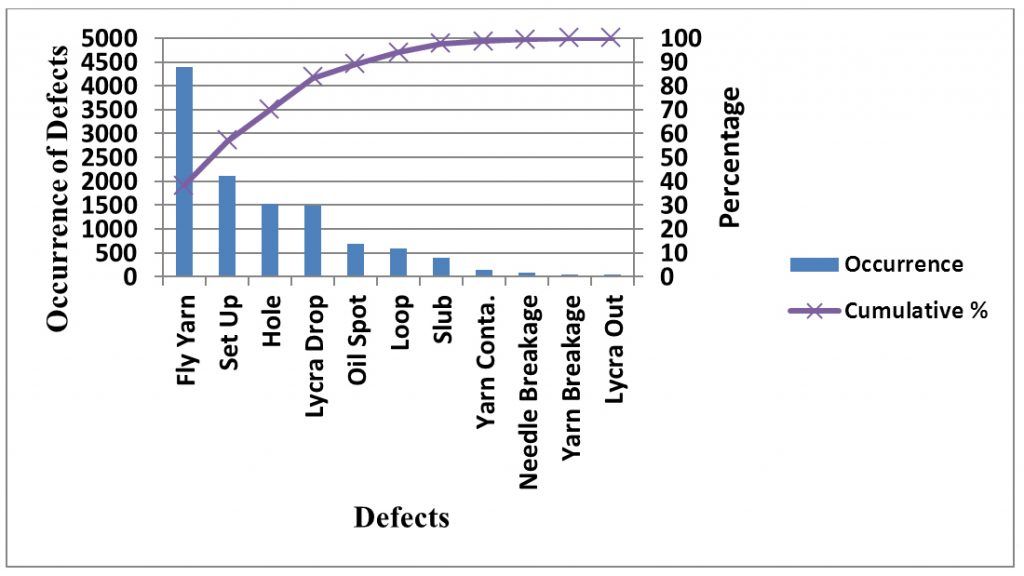
Pareto chart is a special type of bar chart where the plotted values are arranged from largest to smallest. A Pareto chart is used to highlight the most frequently occurring defects, the most common causes of defects, or the most frequent causes of customer complaints (Awaj et al., ). In this research, the major causes or types of defects were identified through Pareto Chart. From the Pareto Chart following major defects were identified.
- Fly Yarn
- Setup
- Hole
- Lycra Drop (This faults only occurred when fabric has lycra attachment)
- Oil Spot
- Loop
- Slub
Among all, only these 7 defects are responsible for 95.56% of total defects.
3.3.2 Cause & effect diagram
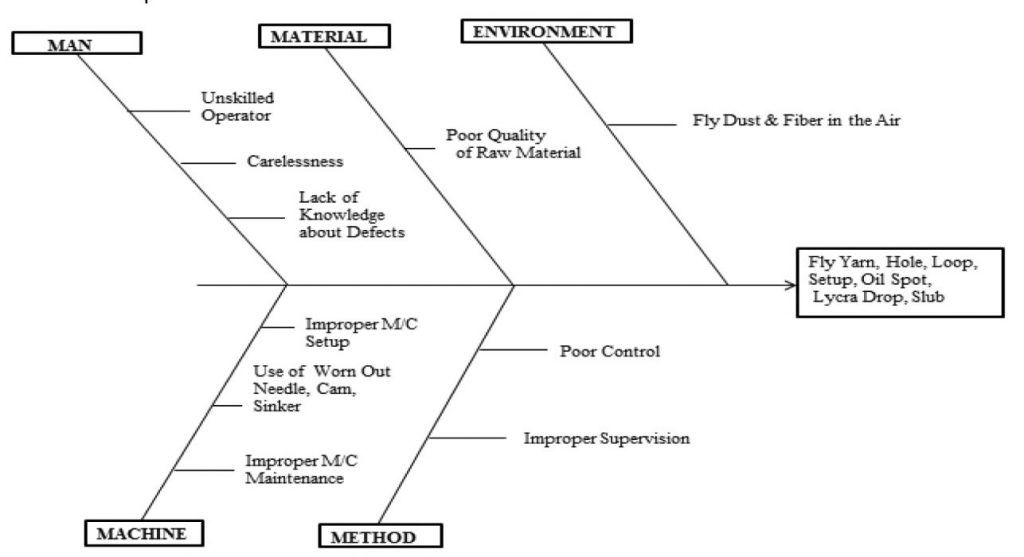
An Ishikawa Cause and Effect (CE) Diagram (also called fishbone or simply cause and effect diagram) is a simple but effective tool that is used to identify different causes of a problem. A Cause & Effect diagram consists of a main "bone" to which main causes of the problem are connected. Each main cause may have several sub-causes that lead to the main cause (Bilsel et al., 2012).The causes were identified in relations to People, Machine, Material, Methods (Procedures) and Environment factors through brainstorming with knitting manager, production officer, floor supervisor, feeder man and machine operator.
3.4 Improve
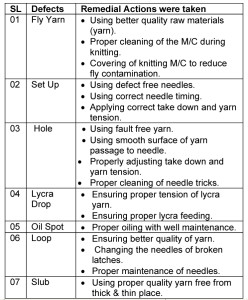
In this phase, possible remedies have been explored for the identified root cause. The remedies for each defect are given below (Table 5).
3.5 Control
Control the improved process or product performance to ensure the target(s) are met. Once the solution has resolved then problem, the improvements must be standardized and sustained over time. The standard-operating-procedures may require revision, and a control plan should be put in place to monitor ongoing performance.
3.5.1 Control plan
The following actions should be taken by the management for sustaining the improvement in grey fabric quality after successful implementation of six-sigma.
- The knitting machine operators should be trained on quality & process control.
- The knitting operators should be trained on different defects & it's remedial action.
- The operators involved in fabric checking should be trained properly on international 4 -point system for ensuring proper reporting.
- The quality of raw material should be checked properly.
- Use of worn out needle, cam, sinker should be prohibited.
- Proper feeding of yarn should be ensured.
- Proper cleaning of knitting zone should be done in regular basis to ensure clean environment.
- The management should give incentives to the operator for high quality performance.
- The focus should be on preventing defects rather than correcting defects.
4 Conclusion
From the Pareto Chart total seven defects (Fly yarn, Setup, Hole, Lycra drop, Oil spot, Loop, Slub) were identified and those defects were responsible for near about 96.56% of total defects occurring in grey fabric during knitting. After finding the major defects, brainstorming tool was used to identify the probable causes and then potential root causes were identified by root cause analysis. Remedial actions were taken for each identified major defects. After successful implementation of remedial actions a tremendous improvement in the grey fabric quality was observed.
References
- M D Teli, New developments in dyeing process control, Indian Journal of Fibre & Textile Research, Vol. 21, March 1996, pp. 41-49.
- J. Maleyeff, F. Kaminsky, Six Sigma and introductory statistics education, Education & training Vol. 44, 2002, pp. 82-89.
- Chethan Kumar C S, Dr. N V R Naidu & Dr. K Ravindranath, Performance improvement of manufacturing industry by reducing the Defectives using Six Sigma Methodologies, IOSR Journal of Engineering, Vol. 1, Issue 1,2010, pp. 001-009.
- Riddhish Thakore, Rajat Dave, Tejas Parsana & Amit Solanki, A Review: Six Sigma Implementation Practice in Manufacturing Industries, Int. Journal of Engineering Research and Applications, Vol. 4, Issue 11(Version - 4), November 2014, pp.63-69.
- Mohammed T. Hayajneh, Omar Bataineh & Rami Al-Tawil, Applying six sigma methodology based on "DMAIC" tools to reduce production defects in textile manufacturing, Industrial engineering department, Jordan University of Science and Technology, ISBN: 978-1-61804-186-9.
- Dr. Rajeshkumar U. Sambhe, Six Sigma practice for quality improvement - A case study of Indian auto ancillary unit, IOSR Journal of Mechanical and Civil Engineering (IOSR-JMCE), ISSN: 2278-1684 Volume 4, Issue 4 (Nov-Dec. 2012), PP 26-42.
- Thomas Pyzdek (2003) "Six Sigma Infrastructure", Quality Digest.
- Sanjit Ray, Prasun Das & Bidyut Kr. Bhattacharya, Improve Customer Complaint Resolution Process Using Six Sigma. Available at http://ieomsociety.org/ieom2011/pdfs/IEOM147.pdf.
- Yonatan Mengesha Awaj, Ajit Pal Singh & Wassihun Yimer. Amedie, International Journal for Quality Research 7(1) 107-126, ISSN 1800-6450.
- R. Ufuk Bilsel and Dennis K.J. Lin, Ishikawa Cause and Effect Diagrams Using Capture Recapture Techniques, Quality Technology & Quantitative Management, Vol. 9, No. 2, pp. 137-152, 2012.


